Whether you are starting up a small blog or running the online presence of a multinational enterprise, analyzing, managing, and understanding website traffic data is crucial to the success of your business. From the perspective of a digital marketing agency, Google Analytics is one of the most powerful and accessible tools out there, with the wealth of free information that it offers. However, with all of that data at your fingertips, it can be easy to feel overwhelmed. Even if you know where to start, you may not be aware of all the many features available, or just how deep you can dig.
Over the years, Bluetext has learned several useful Google Analytics tips and tricks that have allowed us to glean even more valuable business insights for ourselves and our clients. Here are four easy ways you can do the same and dive deeper into your Google Analytics:
1. Automate Reporting Notifications/Set Up Custom Alerts
By default, Google Analytics will notify you of any unusual site activity. However, you can set up your own custom alerts so you don’t have to rely on Google to tell you when something important happens. Custom Alerts is a feature in Google Analytics that allows you to set custom parameters to monitor for unusual site activity and track changes in the metrics that are most meaningful to your business. Once configured, you can opt-in to have Google send you an email notification if a change triggers one of your custom alerts. What may be considered unusual? Say, for example, your site experiences a 200% increase in traffic on a given day. This initially sounds great, but be wary, this could be a bot attack!. If you have Custom Alerts set to notify you for traffic increases of higher than 50% in a day, Google Analytics would record the data surrounding this event and alert you to it.
While it can be tempting to create dozens of alerts to cover every possible anomaly in your traffic, you should focus on tracking information that is most closely related to your business’ top priorities and signals events on which decision-makers are likely to take action. Custom Alerts can be set up to monitor and notify you of things like:
- Analytics Flatlining
- Traffic Drops or Drops in Organic Traffic
- Increases in Referral Traffic/Conversions from Syndicated Content
- Drops or Spikes in Goal Completions
This is an extremely useful tool, because while automated notifications should never be a replacement for regular review of your KPI-based reports, Custom Alerts can assist you by proactively identifying any issues or opportunities, including those you may have missed otherwise.
2. Create Custom and Advanced Visitor Segments
Custom segments are a powerful tool that allow you to dive deeper into your audiences and create reports within reports to gain information about how specific users are interacting on your site. Custom segmentation filters traffic based on particularly chosen criteria including dimensions or metrics, visit date, location, and more, so you can compare the performance and behavior of specific segments to the rest of your users. When implemented this can be used to gain valuable insight into how certain types of visitors behave in comparison to one another, rather than forcing you to make do with a broad overview of all pageviews or sessions.
There are many possible applications of custom segmentation, including:
- Tracking very specific groups of visitors, like male users aged 18-35 who have a strong interest in financial services, visited your site from a mobile device and are located in a particular region
- Identifying high-value customers by filtering for visitors within your target demographic whose sessions lead to a conversion
- Evaluating the performance of a given marketing campaign by identifying new users who that spent more than 20 seconds on your site during a specific time frame

Taking the guesswork out of the equation, custom segments enable you to gain valuable business insights and understand core audiences in a more robust way.
3. Utilize Annotations in your Custom Dashboards and Reports
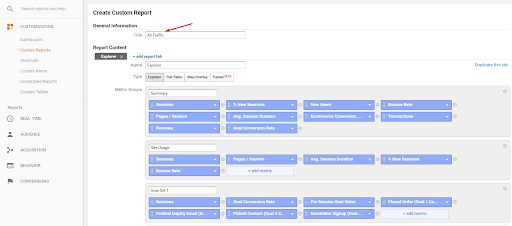
Google Analytics allows you to create custom dashboards and reports so you can quickly access the most valuable data and focus on the KPIs that are most pertinent to your business goals. These dashboards display critical information as they are specifically designed for your needs. However, perhaps you aren’t the only person responsible for looking at these custom dashboards and reports. Maybe you understand the reasons behind any spikes, drops, and other unusual events that appear in your reports, but need a way to keep tabs on why these things happened when. Enter: annotations.
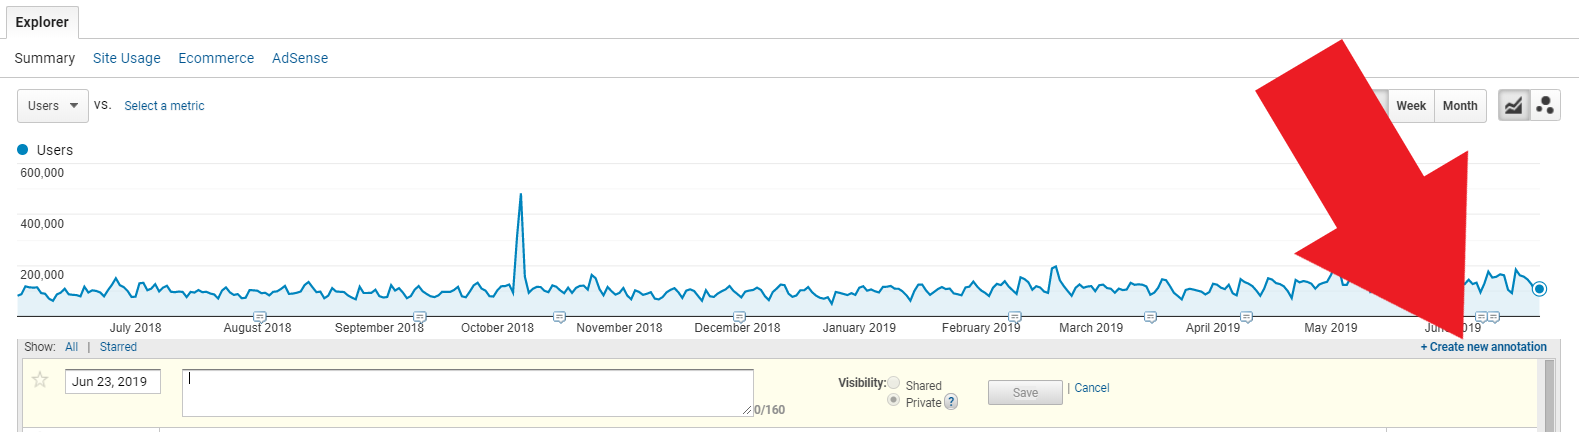
Annotations are simple notes that appear as speech bubble icons along the bottom of an Analytics graph. They can be added by clicking the downward arrow tab icon immediately beneath the graph and then “+Create new annotation”. Aside from recording the note, annotations can also document the date created, the author’s email and be set to “Private” or “Shared” to control who can view the annotation.
 Whether you’re sharing a report with relevant stakeholders and need to explain a certain fluctuation in traffic, need to be reminded of when a content update was made when returning to a graph weeks later, or want make other account managers aware of a promotional campaign that launched on a given day, annotations are a great way to communicate anything of note directly within Analytics.
4. Analyze Behavior Flows to Optimize UX
One of the best ways to improve your user experience is to gain a deep understanding of how your users behave. How are they moving around your site? What pages do they visit, and in what order? Where are they coming from and when are they exiting? Where and when do they convert or drop out of the funnel? Answering these questions can help you discover potential opportunities or problem areas in the user journey, so that you can then prioritize and address them to optimize the user experience. Lucky for you, using Behavior Flow in Google Analytics can help you do just that.
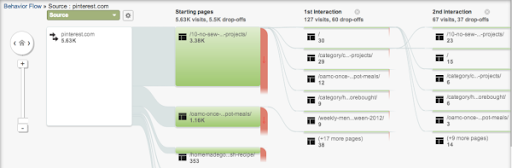
The Behavior Flow report visualizes the path a user follows from one page to the next or from one event to another. This report can give you insights on:
- The most common routes visitors take to get in and out of specific pages
- Pages that are bridges or areas of the site that are conversion hubs
- What content keeps users engaged with your site
- Potential content issues, confusing navigation, or misleading design
- If users are leaving the site when you want them to, like from a “Thank you” page, or right before they convert, indicating a poor customer journey
Additionally, by comparing Behavior Flows to Event tracking- which allows you to track anything and everything that a visitor or a user can click on like CTA buttons, downloadable items, ads or pop-up interactions- you can get a visualization of what within a user flow catches user attention, or not. Analyzing user behavior through Behavior Flows and other means will not only help to improve and optimize the user experience, but produce logical, easy steps that will encourage users towards conversions.
Conclusion
The possibilities are endless when it comes to Google Analytics. The real question is though, how can your business best analyze the data and turn it into actionable intelligence. Enter: a marketing analytics agency, such as Bluetext. A marketing analytics partner will help set up these custom dashboards, pinpoint the key metrics to pay attention to, and help set goals to reach your overall business objectives. Interested in seeing what Google Analytics insights can do for your business? Contact us today.